从SQL 的执行计划来看,主要是是get snapshot time 时间拉长了,那么
根据官网的排查建议,我这边如何确定是raftstore慢还是去获取版本的时候慢呢
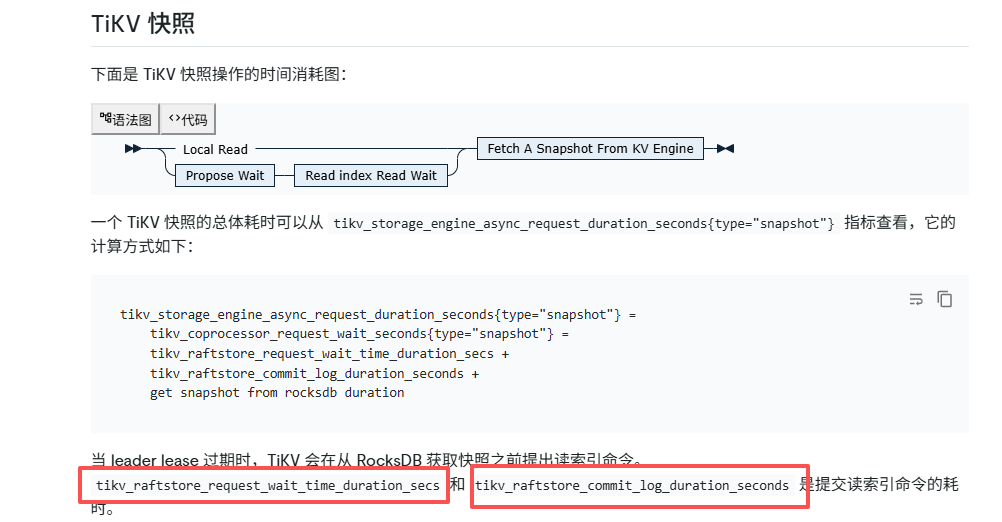
tikv_raftstore_request_wait_time_duration_secs 和 tikv_raftstore_commit_log_duration_seconds这两个指标有监控图吗
从SQL 的执行计划来看,主要是是get snapshot time 时间拉长了,那么
根据官网的排查建议,我这边如何确定是raftstore慢还是去获取版本的时候慢呢
tikv_raftstore_request_wait_time_duration_secs 和 tikv_raftstore_commit_log_duration_secondsTIKV上不能看到吗
tikv_raftstore_request_wait_time_duration_secs 和 tikv_raftstore_commit_log_duration_seconds 的监控图。get snapshot time 依然很高,问题则很可能出在从 RocksDB 获取数据 的环节有监控图,而且你问的这两个指标,在 Grafana TiKV-Details 面板里都能直接看到。
get snapshot 拉长 = 读请求在 TiKV 端排队 / 等待 / 获取最新版本(safe_ts/resolved_ts)变慢,可以通过 Storage 快照耗时 + Raft 相关指标 + Thread CPU 三步区分:是 Raftstore 忙 还是 获取版本(读一致性)慢。
在哪个监控面板
感谢老师分享
darshboard应该有这一部分监控显示吧