

背景:因慢SQL导致了内存持续飙升,OOM溢出会导致PD节点故障,服务重启,集群短时间内无法连接。
一、 云平台告警
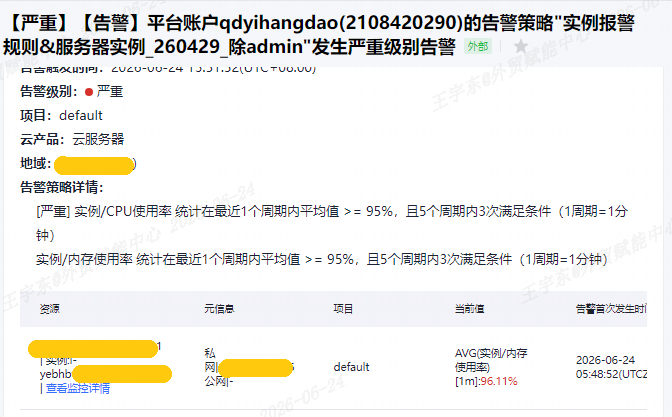
云平台监控显示内存,如下图持续告警
二、报错
9001:PD server timeout: start timestamp may fall behind safe point [ SQL语句 ] : SELECT ......
三、dashboar日志界面ERROR级别
2026-06-24 13:05:45 (UTC+08:00) PD 1.6.1.1:2379 [etcdutil.go:162] ["load from etcd meet error"] [key=/pd/7586567365674175536/member/2020278184460503592/leader_priority] [error="[PD:etcd:ErrEtcdKVGet]context deadline exceeded: context deadline exceeded"] 2026-06-24 13:05:45 (UTC+08:00) PD 1.6.1.1:2379 [member.go:293] ["failed to load leader priority"] [error="[PD:etcd:ErrEtcdKVGet]context deadline exceeded: context deadline exceeded"] 2026-06-24 13:05:45 (UTC+08:00) PD 1.6.1.1:2379 [etcdutil.go:162] ["load from etcd meet error"] [key=/pd/7586567365674175536/dc-location] [error="[PD:etcd:ErrEtcdKVGet]context deadline exceeded: context deadline exceeded"] 2026-06-24 13:05:45 (UTC+08:00) PD 1.6.1.1:2379 [allocator_manager.go:828] ["get cluster dc-locations from etcd failed"] [] [error="[PD:etcd:ErrEtcdKVGet]context deadline exceeded: context deadline exceeded"] 2026-06-24 13:05:46 (UTC+08:00) TiDB 1.6.1.1:4000 [domain.go:1124] ["reload schema in loop failed"] [error="[tikv:9001]PD server timeout: start timestamp may fall behind safe point"] 2026-06-24 13:05:46 (UTC+08:00) TiDB 1.6.1.1:4000 [domain.go:2092] ["update bindinfo failed"] [error="[tikv:9001]PD server timeout: start timestamp may fall behind safe point"] 2026-06-24 13:05:46 (UTC+08:00) TiDB 1.6.1.1:4000 [manager.go:369] ["task manager met error"] [error="[tikv:9001]PD server timeout: start timestamp may fall behind safe point"] [stack="github.com/平凯星辰/tidb/pkg/disttask/framework/taskexecutor.(*Manager).logErr\n\t/workspace/source/tidb/pkg/disttask/framework/taskexecutor/manager.go:369\ngithub.com/平凯星辰/tidb/pkg/disttask/framework/taskexecutor.(*Manager).handleTasks\n\t/workspace/source/tidb/pkg/disttask/framework/taskexecutor/manager.go:195\ngithub.com/平凯星辰/tidb/pkg/disttask/framework/taskexecutor.(*Manager).handleTasksLoop\n\t/workspace/source/tidb/pkg/disttask/framework/taskexecutor/manager.go:184\ngithub.com/平凯星辰/tidb/pkg/util.(*WaitGroupWrapper).Run.func1\n\t/workspace/source/tidb/pkg/util/wait_group_wrapper.go:157"]
2026-06-24 13:25:33 (UTC+08:00)TiDB 1.6.1.1:4000[memoryusagealarm.go:215] [“tidb-server has the risk of OOM because of memory usage exceeds alarm ratio. Running SQLs and heap profile will be recorded in record path”] [“is tidb_server_memory_limit set”=true] [tidb_server_memory_limit=13193022640] [“tidb-server memory usage”=13106027264] [memory-usage-alarm-ratio=0.7] [“record path”=/app/tidb-deploy/tidb-4000/log/oom_record] 2026-06-24 13:25:34 (UTC+08:00)TiDB 1.6.1.1:4000[memoryusagealarm.go:215] [“tidb-server has the risk of OOM because of memory usage exceeds alarm ratio. Running SQLs and heap profile will be recorded in record path”] [“is tidb_server_memory_limit set”=true] [tidb_server_memory_limit=13193022640] [“tidb-server memory usage”=9699310160] [memory-usage-alarm-ratio=0.7] [“record path”=/app/tidb-deploy/tidb-4000/log/oom_record] 2026-06-24 13:25:54 (UTC+08:00)TiDB 1.6.1.1:4000[memoryusagealarm.go:215] [“tidb-server has the risk of OOM because of memory usage grows too fast. Running SQLs and heap profile will be recorded in record path”] [“is tidb_server_memory_limit set”=true] [tidb_server_memory_limit=13193022640] [“tidb-server memory usage”=11025140336] [memory-usage-alarm-ratio=0.7] [“record path”=/app/tidb-deploy/tidb-4000/log/oom_record]
四、dashboar日志界面WARN级别
PD:1.1.6.1 unhealthy,其他PD节点无法响应
2026-06-24 13:01:00 (UTC+08:00) PD 1.1.6.2:2379 [health_checker.go:194] ["etcd endpoint is unhealthy"] [endpoint=http://1.1.6.1:2379] [took=10.000341297s] [source=election-etcd-client] 2026-06-24 13:01:10 (UTC+08:00) PD 1.1.6.3:2379 [health_checker.go:194] ["etcd endpoint is unhealthy"] [endpoint=http://1.1.6.1:2379] [took=10.000568506s] [source=server-etcd-client] 2026-06-24 13:01:10 (UTC+08:00) PD 1.1.6.3:2379 [health_checker.go:194] ["etcd endpoint is unhealthy"] [endpoint=http://1.1.6.1:2379] [took=10.000487754s] [source=election-etcd-client]
五、根据日志找到了对应1.1.6.1节点服务器,查看OOM记录文件
5.1 查看TiDB Server 进程标准错误输出日志
cd /app/tidb-deploy/tidb-4000/log/oom_record
[root@fnzx-tidb-tidb-pd-1 oom_record]# ll
总用量 20
drwxr-x--- 2 tidb tidb 4096 6月 24 16:03 record2026-06-24T13:45:11+08:00
drwxr-x--- 2 tidb tidb 4096 6月 24 16:04 record2026-06-24T13:46:11+08:00
drwxr-x--- 2 tidb tidb 4096 6月 24 17:05 record2026-06-24T13:47:07+08:00
drwxr-x--- 2 tidb tidb 4096 6月 24 16:50 record2026-06-24T13:49:20+08:00
drwxr-x--- 2 tidb tidb 4096 6月 24 13:50 record2026-06-24T13:50:05+08:00
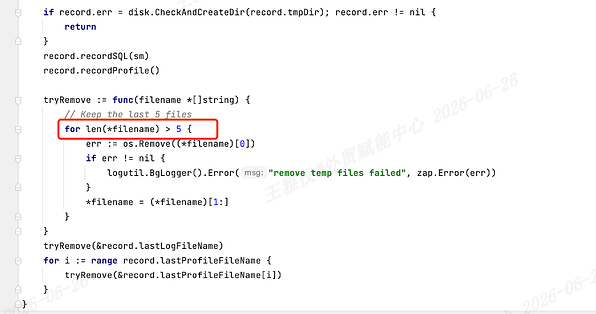
-- 这里只保存5条记录,新记录会把之前的记录覆盖,而且不能通过修改参数调整记录的数量,代码是写死的。
5.2 cd到产生故障的时间点的目录
[root@fnzx-tidb-tidb-pd-1 record2026-06-24T13:50:05+08:00]# ll 总用量 4292 -rw-r--r-- 1 tidb tidb 342008 6月 24 13:50 goroutine -rw-r--r-- 1 tidb tidb 4038865 6月 24 13:50 heap -rw-r--r-- 1 tidb tidb 5892 6月 24 13:50 running_sql
cat running_sql
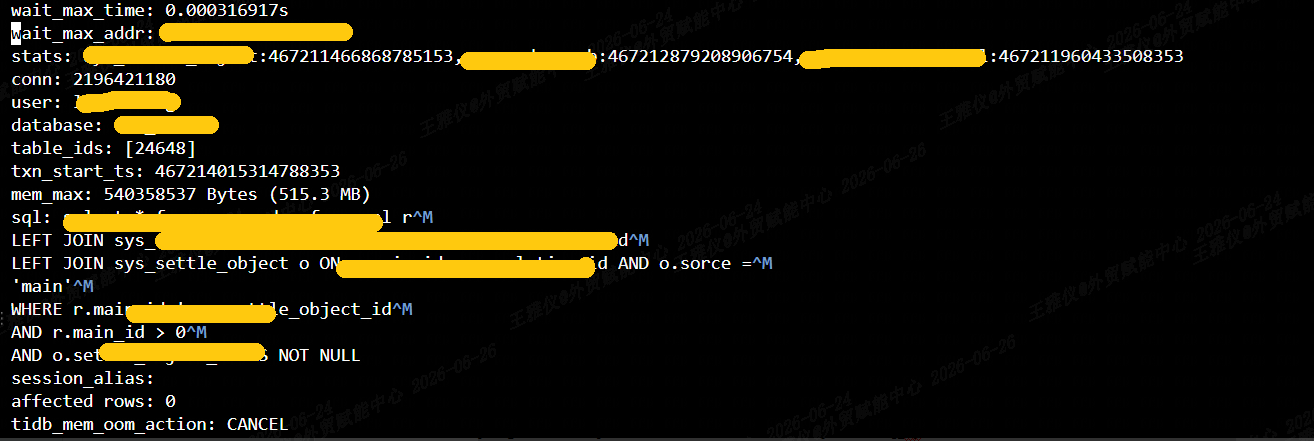
会找到产生OOM的SQL,内存使用达到了515M。dashboard的SQL语句分析也可以定位到这条SQL,检查之后发现执行了2m以上的时间。
影响的参数:
-- 内存参数 show variables like 'tidb_server_memory_limit'; -- 80%,数据库目前内存已使用了70% show variables like '%tidb_mem%';
tidb_mem_oom_action CANCEL 达到阈值TIDB直接取消
-- TiDB 单条 SQL 允许占用的内存上限
show variables like 'tidb_mem_quota_query'; -- 4294967296 4G,有些大,调整成了2G
SET GLOBAL tidb_mem_quota_query = 2147483648;
show variables like 'tidb_distsql_scan_concurrency'; -- 15 控制查询扫描数据时并行度
这几个参数需要结合分析
==================================================
以上是对故障的排查思路,以下是解决思路
六、解决
1、 监测到内存一直飙升,查看集群进程列表,直接kill掉大SQL
SELECT * FROM INFORMATION_SCHEMA.CLUSTER_PROCESSLIST;
2、SQL优化,减少非必要返回的数据量
3、减少大事务,将大事务拆分为小事务
4、调整TiDB Server相关参数,来限制单条SQL内存的使用
tidb_server_memory_limit
tidb_mem_quota_query
tidb_distsql_scan_concurrency
5、启用临时磁盘
oom_use_tmp_storage
tmp_storage-path
tmp_storage-quota
-- 高版本:tidb_enable_tmp_storage_on_oom