【 TiDB 使用环境】生产环境
【 TiDB 版本】TiDB-v5.4.1
【操作系统】ctyunos
【部署方式】云上部署(天翼云)(16C 64G SSD(2000G))
【集群数据量】4.0T
【集群节点数】PD(3)、TIDB(17)、TIK(19)
【问题】tidb在高并发请求时自动执行统计信息收集后执行计划出现偏差导致join查询全表扫描,SQL执行耗时超20秒,被超时kill掉,业务堵塞受损
【影响】tidb负载高,业务SQL堵塞
【分析】
1、慢日志抓取SQL:select t1.id from t_sys_user t1 left join t_user_role t2 on t1.id=t2.user_id left join t_role t3 on t2.role_id = t3.id where t3.role_type in (3,4) and t1.account = “153xxxxx086”;
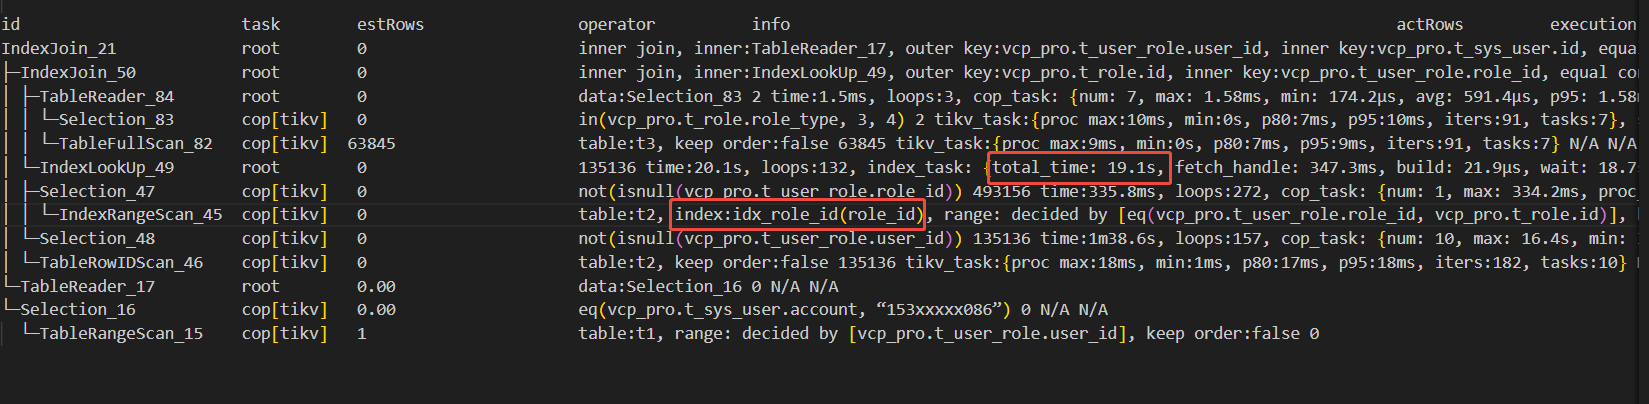
2、查看SQL的执行计划,t_role表的过滤条件失效,变成了全表扫描,执行计划如下:
explain analyze select t1.id from t_sys_user t1 left join t_user_role t2 on t1.id=t2.user_id left join t_role t3 on t2.role_id = t3.id where t3.role_type in (3,4) and t1.account = “153xxxxx086”;
±----------------------------------±---------±--------±----------±-------------------------------------±---------------------------------------------------------------------------------------------------------------------------------------------------------------------------------------------------------------------------------------------------------------------±----------------------------------------------------------------------------------------------------------------------------------------------------------------------------±----------±-----+
| id | estRows | actRows | task | access object | execution info | operator info | memory | disk |
±----------------------------------±---------±--------±----------±-------------------------------------±---------------------------------------------------------------------------------------------------------------------------------------------------------------------------------------------------------------------------------------------------------------------±----------------------------------------------------------------------------------------------------------------------------------------------------------------------------±----------±-----+
| IndexJoin_21 | 0.00 | 0 | root | | time:41.3ms, loops:1, | inner join, inner:TableReader_17, outer key:vcp_pro.t_user_role.user_id, inner key:vcp_pro.t_sys_user.id, equal cond:eq(vcp_pro.t_user_role.user_id, vcp_pro.t_sys_user.id) | 0 Bytes | N/A |
| ├─IndexJoin_50(Build) | 0.00 | 0 | root | | time:41.3ms, loops:1, | inner join, inner:IndexLookUp_49, outer key:vcp_pro.t_role.id, inner key:vcp_pro.t_user_role.role_id, equal cond:eq(vcp_pro.t_role.id, vcp_pro.t_user_role.role_id) | 0 Bytes | N/A |
| │ ├─TableReader_84(Build) | 0.00 | 0 | root | | time:41.3ms, loops:1, cop_task: {num: 1, max: 41.3ms, proc_keys: 63924, tot_proc: 40ms, tot_wait: 1ms, rpc_num: 1, rpc_time: 41.3ms, copr_cache_hit_ratio: 0.00} | data:Selection_83 | 235 Bytes | N/A |
| │ │ └─Selection_83 | 0.00 | 0 | cop[tikv] | | tikv_task:{time:40ms, loops:67}, scan_detail: {total_process_keys: 63924, total_process_keys_size: 6217034, total_keys: 128611, rocksdb: {delete_skipped_count: 63887, key_skipped_count: 128632, block: {cache_hit_count: 185, read_count: 0, read_byte: 0 Bytes}}} | in(vcp_pro.t_role.role_type, 3, 4) | N/A | N/A |
| │ │ └─TableFullScan_82 | 63924.00 | 63924 | cop[tikv] | table:t3 | tikv_task:{time:37ms, loops:67} | keep order:false | N/A | N/A |
| │ └─IndexLookUp_49(Probe) | 0.00 | 0 | root | | | | N/A | N/A |
| │ ├─Selection_47(Build) | 0.00 | 0 | cop[tikv] | | | not(isnull(vcp_pro.t_user_role.role_id)) | N/A | N/A |
| │ │ └─IndexRangeScan_45 | 0.00 | 0 | cop[tikv] | table:t2, index:idx_role_id(role_id) | | range: decided by [eq(vcp_pro.t_user_role.role_id, vcp_pro.t_role.id)], keep order:false | N/A | N/A |
| │ └─Selection_48(Probe) | 0.00 | 0 | cop[tikv] | | | not(isnull(vcp_pro.t_user_role.user_id)) | N/A | N/A |
| │ └─TableRowIDScan_46 | 0.00 | 0 | cop[tikv] | table:t2 | | keep order:false | N/A | N/A |
| └─TableReader_17(Probe) | 0.00 | 0 | root | | | data:Selection_16 | N/A | N/A |
| └─Selection_16 | 0.00 | 0 | cop[tikv] | | | eq(vcp_pro.t_sys_user.account, “153xxxxx086”) | N/A | N/A |
| └─TableRangeScan_15 | 1.00 | 0 | cop[tikv] | table:t1 | | range: decided by [vcp_pro.t_user_role.user_id], keep order:false | N/A | N/A |
±----------------------------------±---------±--------±----------±-------------------------------------±---------------------------------------------------------------------------------------------------------------------------------------------------------------------------------------------------------------------------------------------------------------------±----------------------------------------------------------------------------------------------------------------------------------------------------------------------------±----------±-----+
3、故障期间t_role表的STATS_buckets统计数据丢失
mysql> show STATS_topn where table_name = ‘t_role’ and column_name = ‘role_type’;
±--------±-----------±---------------±------------±---------±------±------+
| Db_name | Table_name | Partition_name | Column_name | Is_index | Value | Count |
±--------±-----------±---------------±------------±---------±------±------+
| vcp_pro | t_role | | role_type | 0 | 5 | 53416 |
| vcp_pro | t_role | | role_type | 0 | 13 | 2536 |
| vcp_pro | t_role | | role_type | 0 | 14 | 64 |
| vcp_pro | t_role | | role_type | 0 | 99 | 1296 |
±--------±-----------±---------------±------------±---------±------±------+
4 rows in set (0.09 sec)
mysql> show STATS_buckets where table_name = ‘t_role’ and column_name = ‘role_type’;
Empty set (0.15 sec)
4、收集统计信息时表的健康度为100
mysql> SHOW STATS_HEALTHY where table_name = ‘t_role’;
±--------±-----------±---------------±--------+
| Db_name | Table_name | Partition_name | Healthy |
±--------±-----------±---------------±--------+
| vcp_pro | t_role | | 100 |
±--------±-----------±---------------±--------+
1 row in set (0.00 sec)
5、SQL的正常执行计划中t_role表的过滤条件有效,扫描2行数据进行join查询,耗时约5ms,正常的执行计划如下:
explain analyze select t1.id from t_sys_user t1 left join t_user_role t2 on t1.id=t2.user_id left join t_role t3 on t2.role_id = t3.id where t3.role_type in (3,4) and t1.account = “153xxxxx086”;
±--------------------------------±--------±--------±----------±---------------------------------------------------±--------------------------------------------------------------------------------------------------------------------------------------------------------------------------------------------------------------------------------------------------------------------------------±----------------------------------------------------------------------------------------------------------------------------------------------------------------------------±----------±-----+
| id | estRows | actRows | task | access object | execution info | operator info | memory | disk |
±--------------------------------±--------±--------±----------±---------------------------------------------------±--------------------------------------------------------------------------------------------------------------------------------------------------------------------------------------------------------------------------------------------------------------------------------±----------------------------------------------------------------------------------------------------------------------------------------------------------------------------±----------±-----+
| IndexJoin_18 | 1.21 | 0 | root | | time:6.49ms, loops:1, inner:{total:575.5µs, concurrency:5, task:1, construct:11.3µs, fetch:562.6µs, build:81ns}, probe:1.97µs | inner join, inner:TableReader_14, outer key:vcp_pro.t_user_role.role_id, inner key:vcp_pro.t_role.id, equal cond:eq(vcp_pro.t_user_role.role_id, vcp_pro.t_role.id) | 16.8 KB | N/A |
| ├─IndexJoin_50(Build) | 1.21 | 2 | root | | time:5.84ms, loops:3, inner:{total:3.07ms, concurrency:5, task:1, construct:20.9µs, fetch:3.04ms, build:3.23µs}, probe:4.66µs | inner join, inner:IndexReader_49, outer key:vcp_pro.t_sys_user.id, inner key:vcp_pro.t_user_role.user_id, equal cond:eq(vcp_pro.t_sys_user.id, vcp_pro.t_user_role.user_id) | 41.5 KB | N/A |
| │ ├─IndexReader_77(Build) | 1.18 | 2 | root | | time:2.71ms, loops:3, cop_task: {num: 1, max: 2.75ms, proc_keys: 2, rpc_num: 1, rpc_time: 2.74ms, copr_cache_hit_ratio: 0.00} | index:IndexRangeScan_76 | 299 Bytes | N/A |
| │ │ └─IndexRangeScan_76 | 1.18 | 2 | cop[tikv] | table:t1, index:idx_account(account) | tikv_task:{time:0s, loops:1}, scan_detail: {total_process_keys: 2, total_process_keys_size: 150, total_keys: 3, rocksdb: {delete_skipped_count: 0, key_skipped_count: 2, block: {cache_hit_count: 10, read_count: 1, read_byte: 36.7 KB}}} | range:[“153xxxxx086”,“153xxxxx086”], keep order:false | N/A | N/A |
| │ └─IndexReader_49(Probe) | 1.02 | 2 | root | | time:2.39ms, loops:2, cop_task: {num: 2, max: 2.35ms, min: 780.8µs, avg: 1.57ms, p95: 2.35ms, max_proc_keys: 1, p95_proc_keys: 1, rpc_num: 2, rpc_time: 3.12ms, copr_cache_hit_ratio: 0.00} | index:Selection_48 | 307 Bytes | N/A |
| │ └─Selection_48 | 1.02 | 2 | cop[tikv] | | tikv_task:{proc max:0s, min:0s, p80:0s, p95:0s, iters:2, tasks:2}, scan_detail: {total_process_keys: 2, total_process_keys_size: 106, total_keys: 4, rocksdb: {delete_skipped_count: 0, key_skipped_count: 2, block: {cache_hit_count: 17, read_count: 2, read_byte: 42.0 KB}}} | not(isnull(vcp_pro.t_user_role.user_id)) | N/A | N/A |
| │ └─IndexRangeScan_47 | 1.02 | 2 | cop[tikv] | table:t2, index:un_inx_user_role(user_id, role_id) | tikv_task:{proc max:0s, min:0s, p80:0s, p95:0s, iters:2, tasks:2} | range: decided by [eq(vcp_pro.t_user_role.user_id, vcp_pro.t_sys_user.id) not(isnull(vcp_pro.t_user_role.role_id))], keep order:false | N/A | N/A |
| └─TableReader_14(Probe) | 0.00 | 0 | root | | time:505.7µs, loops:1, cop_task: {num: 1, max: 469.2µs, proc_keys: 2, rpc_num: 1, rpc_time: 462.2µs, copr_cache_hit_ratio: 0.00} | data:Selection_13 | N/A | N/A |
| └─Selection_13 | 0.00 | 0 | cop[tikv] | | tikv_task:{time:0s, loops:1}, scan_detail: {total_process_keys: 2, total_process_keys_size: 174, total_keys: 3, rocksdb: {delete_skipped_count: 1, key_skipped_count: 1, block: {cache_hit_count: 16, read_count: 0, read_byte: 0 Bytes}}} | in(vcp_pro.t_role.role_type, 3, 4) | N/A | N/A |
| └─TableRangeScan_12 | 1.00 | 2 | cop[tikv] | table:t3 | tikv_task:{time:0s, loops:1} | range: decided by [vcp_pro.t_user_role.role_id], keep order:false | N/A | N/A |
±--------------------------------±--------±--------±----------±---------------------------------------------------±--------------------------------------------------------------------------------------------------------------------------------------------------------------------------------------------------------------------------------------------------------------------------------±----------------------------------------------------------------------------------------------------------------------------------------------------------------------------±----------±-----+
6、查看t_role表的role_type 包含3和4符合条件的行,查询出2条数据
mysql> select * from t_role where role_type in (3,4);
±—±------±-------------------------±--------------------±--------±----------±-----------±----------±-------------±--------+
| id | adm | name | createtime | creator | parent_id | group_type | role_type | default_role | user_id |
±—±------±-------------------------±--------------------±--------±----------±-----------±----------±-------------±--------+
| 3 | NULL | xx主 | 2021-07-21 16:58:24 | 2 | NULL | 2 | 3 | 1 | NULL |
| 4 | NULL | x础、xx | 2021-07-21 17:02:08 | 2 | NULL | 2 | 4 | 1 | NULL |
±—±------±-------------------------±--------------------±--------±----------±-----------±----------±-------------±--------+
2 rows in set (0.04 sec)
7、查看tidb日志,确认t_role表执行过并完成统计信息收集,t_role表在收集统计信息时数据约48756行
[2025/07/31 15:32:45.218 +08:00] [INFO] [update.go:1092] [“[stats] auto analyze triggered”] [sql=“analyze table vcp_pro.t_role”] [reason=“too many modifications(14632/48756>0.3)”]
[2025/07/31 15:32:52.809 +08:00] [INFO] [analyze.go:130] [“analyze table vcp_pro.t_role has finished”] [partition=] [“job info”=“auto analyze table”] [“start time”=2025/07/31 15:32:45.221 +08:00] [“end time”=2025/07/31 15:32:52.809 +08:00] [cost=7.587762102s]
 贴错了,这个执行计划才是: