为提高效率,请提供以下信息,问题描述清晰能够更快得到解决:
【 TiDB 使用环境】
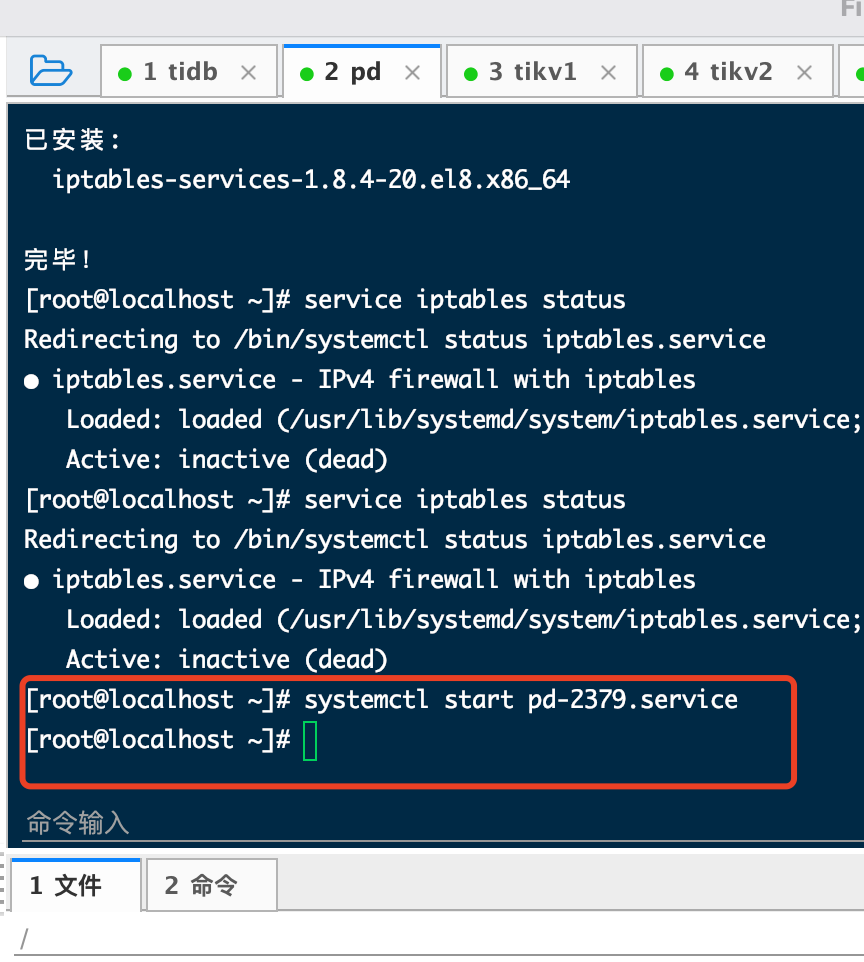
【概述】新部署的tidb 启动的时候报错
Error: failed to start pd: failed to start: 192.168.38.64 pd-2379.service, please check the instance’s log(/tidb-deploy/pd-2379/log) for more detail.: timed out waiting for port 2379 to be started after 2m0s
【背景】做过哪些操作
啥也没干 刚准备启动
【现象】业务和数据库现象
【业务影响】
【TiDB 版本】
【附件】
- 相关日志 和 监控
2021-11-17T02:37:52.848-0500 INFO SSHCommand {“host”: “192.168.38.63”, “port”: “22”, “cmd”: “export LANG=C; PATH=$PATH:/bin:/sbin:/usr/bin:/usr/sbin ss -ltn”, “stdout”: “State Recv-Q Send-Q Local Address:Port Peer Address:Port \ LISTEN 0 128 0.0.0.0:22 0.0.0.0:* \ LISTEN 0 128 [::]:22 [::]:* \ ”, “stderr”: “”}
2021-11-17T02:37:52.848-0500 INFO CheckPoint {“host”: “192.168.38.63”, “port”: 22, “user”: “tidb”, “sudo”: false, “cmd”: “ss -ltn”, “stdout”: “State Recv-Q Send-Q Local Address:Port Peer Address:Port \ LISTEN 0 128 0.0.0.0:22 0.0.0.0:* \ LISTEN 0 128 [::]:22 [::]:* \ ”, “stderr”: “”, “hash”: “ce8eb0a645cc3ead96a44d67b1ecd5034d112cf0”, “func”: “github.com/pingcap/tiup/pkg/cluster/executor.(*CheckPointExecutor).Execute”, “hit”: false}
2021-11-17T02:37:52.848-0500 DEBUG retry error: operation timed out after 2m0s
2021-11-17T02:37:52.848-0500 DEBUG TaskFinish {“task”: “StartCluster”, “error”: “failed to start pd: failed to start: 192.168.38.63 pd-2379.service, please check the instance’s log(/tidb-deploy/pd-2379/log) for more detail.: timed out waiting for port 2379 to be started after 2m0s”, “errorVerbose”: “timed out waiting for port 2379 to be started after 2m0s\ngithub.com/pingcap/tiup/pkg/cluster/module.(*WaitFor).Execute\ \tgithub.com/pingcap/tiup/pkg/cluster/module/wait_for.go:91\ github.com/pingcap/tiup/pkg/cluster/spec.PortStarted\ \tgithub.com/pingcap/tiup/pkg/cluster/spec/instance.go:115\ github.com/pingcap/tiup/pkg/cluster/spec.(*BaseInstance).Ready\ \tgithub.com/pingcap/tiup/pkg/cluster/spec/instance.go:147\ github.com/pingcap/tiup/pkg/cluster/operation.startInstance\ \tgithub.com/pingcap/tiup/pkg/cluster/operation/action.go:359\ github.com/pingcap/tiup/pkg/cluster/operation.StartComponent.func1\ \tgithub.com/pingcap/tiup/pkg/cluster/operation/action.go:485\ golang.org/x/sync/errgroup.(*Group).Go.func1\ \tgolang.org/x/sync@v0.0.0-20210220032951-036812b2e83c/errgroup/errgroup.go:57\ runtime.goexit\ \truntime/asm_amd64.s:1581\ failed to start: 192.168.38.63 pd-2379.service, please check the instance’s log(/tidb-deploy/pd-2379/log) for more detail.\ failed to start pd”}
2021-11-17T02:37:52.848-0500 INFO Execute command finished {“code”: 1, “error”: “failed to start pd: failed to start: 192.168.38.63 pd-2379.service, please check the instance’s log(/tidb-deploy/pd-2379/log) for more detail.: timed out waiting for port 2379 to be started after 2m0s”, “errorVerbose”: “timed out waiting for port 2379 to be started after 2m0s\ngithub.com/pingcap/tiup/pkg/cluster/module.(*WaitFor).Execute\ \tgithub.com/pingcap/tiup/pkg/cluster/module/wait_for.go:91\ github.com/pingcap/tiup/pkg/cluster/spec.PortStarted\ \tgithub.com/pingcap/tiup/pkg/cluster/spec/instance.go:115\ github.com/pingcap/tiup/pkg/cluster/spec.(*BaseInstance).Ready\ \tgithub.com/pingcap/tiup/pkg/cluster/spec/instance.go:147\ github.com/pingcap/tiup/pkg/cluster/operation.startInstance\ \tgithub.com/pingcap/tiup/pkg/cluster/operation/action.go:359\ github.com/pingcap/tiup/pkg/cluster/operation.StartComponent.func1\ \tgithub.com/pingcap/tiup/pkg/cluster/operation/action.go:485\ golang.org/x/sync/errgroup.(*Group).Go.func1\ \tgolang.org/x/sync@v0.0.0-20210220032951-036812b2e83c/errgroup/errgroup.go:57\ runtime.goexit\ \truntime/asm_amd64.s:1581\ failed to start: 192.168.38.63 pd-2379.service, please check the instance’s log(/tidb-deploy/pd-2379/log) for more detail.\ failed to start pd”}
topology.yaml的配置信息:
# Global variables are applied to all deployments and used as the default value of
# the deployments if a specific deployment value is missing.
global:
user: “tidb”
ssh_port: 22
deploy_dir: “/tidb-deploy”
data_dir: “/tidb-data”
# Monitored variables are applied to all the machines.
node_exporter_port: 9100
blackbox_exporter_port: 9115
deploy_dir: “/tidb-deploy/monitored-9100”
data_dir: “/tidb-data/monitored-9100”
log_dir: “/tidb-deploy/monitored-9100/log”
# Server configs are used to specify the runtime configuration of TiDB components.
# All configuration items can be found in TiDB docs:
# - TiDB: https://pingcap.com/docs/stable/reference/configuration/tidb-server/configuration-file/
# - TiKV: https://pingcap.com/docs/stable/reference/configuration/tikv-server/configuration-file/
# - PD: https://pingcap.com/docs/stable/reference/configuration/pd-server/configuration-file/
# All configuration items use points to represent the hierarchy, e.g:
# readpool.storage.use-unified-pool
# You can overwrite this configuration via the instance-level config field.
server_configs:
tidb:
log.slow-threshold: 300
binlog.enable: false
binlog.ignore-error: false
tikv:
# server.grpc-concurrency: 4
# raftstore.apply-pool-size: 2
# raftstore.store-pool-size: 2
# rocksdb.max-sub-compactions: 1
# storage.block-cache.capacity: "16GB"
# readpool.unified.max-thread-count: 12
readpool.storage.use-unified-pool: false
readpool.coprocessor.use-unified-pool: true
pd:
replication.enable-placement-rules: true
schedule.leader-schedule-limit: 4
schedule.region-schedule-limit: 2048
schedule.replica-schedule-limit: 64
tidb_servers:
- host: 192.168.38.63
ssh_port: 22
port: 4000
status_port: 10080
deploy_dir: “/tidb-deploy/tidb-4000”
log_dir: “/tidb-deploy/tidb-4000/log”
numa_node: “0,1”
# The following configs are used to overwrite the
server_configs.tidbvalues.config:
log.slow-query-file: tidb-slow-overwrited.log
pd_servers:
- host: 192.168.38.64
ssh_port: 22
name: “pd-1”
client_port: 2379
peer_port: 2380
deploy_dir: “/tidb-deploy/pd-2379”
data_dir: “/tidb-data/pd-2379”
log_dir: “/tidb-deploy/pd-2379/log”
numa_node: “0,1”
# The following configs are used to overwrite the
server_configs.pdvalues.config:
schedule.max-merge-region-size: 20
schedule.max-merge-region-keys: 200000
tikv_servers:
- host: 192.168.38.60
ssh_port: 22
port: 20160
status_port: 20180
deploy_dir: “/tidb-deploy/tikv-20160”
data_dir: “/tidb-data/tikv-20160”
log_dir: “/tidb-deploy/tikv-20160/log”
numa_node: “0,1”
# The following configs are used to overwrite the
server_configs.tikvvalues.config:
server.grpc-concurrency: 4
server.labels: { zone: “zone1”, dc: “dc1”, host: “host1” }
- host: 192.168.38.61
- host: 192.168.38.62
tiflash_servers:
- host: 192.168.38.65
monitoring_servers:
- host: 192.168.38.64
ssh_port: 22
port: 9090
deploy_dir: “/tidb-deploy/prometheus-8249”
data_dir: “/tidb-data/prometheus-8249”
log_dir: “/tidb-deploy/prometheus-8249/log”
grafana_servers:
- host: 192.168.38.64
port: 3000
deploy_dir: /tidb-deploy/grafana-3000
alertmanager_servers:
- host: 192.168.38.64
ssh_port: 22
web_port: 9093
cluster_port: 9094
deploy_dir: “/tidb-deploy/alertmanager-9093”
data_dir: “/tidb-data/alertmanager-9093”
log_dir: “/tidb-deploy/alertmanager-9093/log”