

一、背景
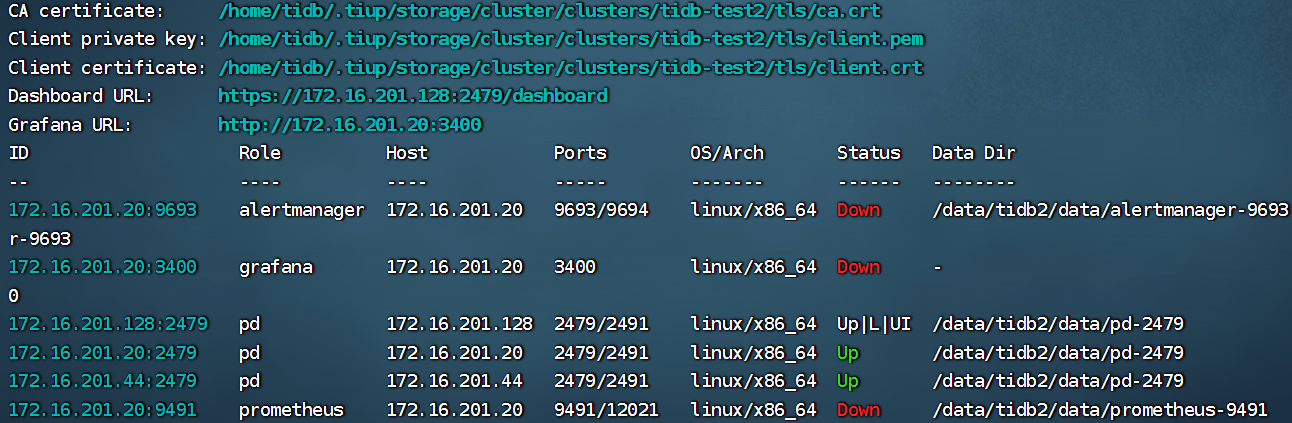
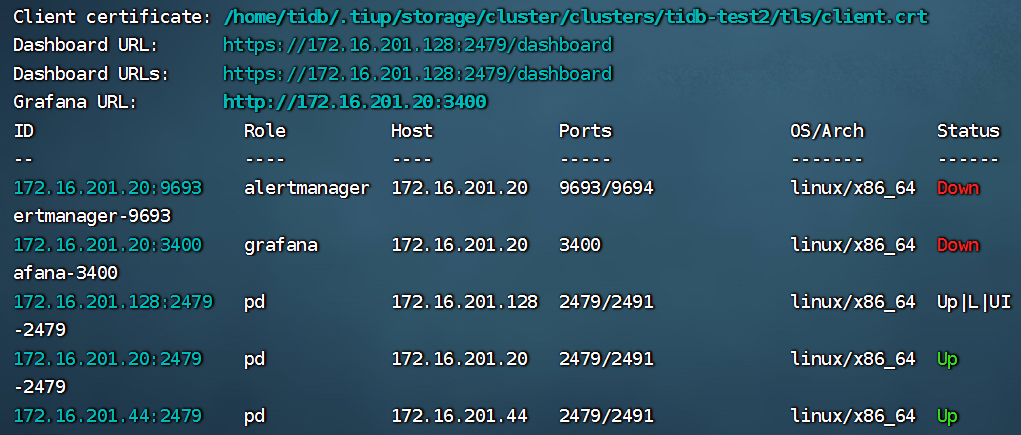
用户使用平凯数据库 7.1.8-5.3,在 tiup cluster display <cluster-name> 时,显示监控三组件均为 down,而实际检查发现组件实际是 Up 状态的,疑似 tiup cluster 错误显示组件状态。
二、测试
v1.16.2(社区版)
[tidb@vm172-16-201-23 v1.16.2]$ ./tiup-cluster -v
tiup-cluster version 1.16.2 tiup
Go Version: go1.21.13
Git Ref: v1.16.2
GitHash: 678c52de0c0ef30634b8ba7302a8376caa95d50d
v1.16.2-20250905(平凯 7.1.8-5.3 自带)
[tidb@vm172-16-201-23 v1.16.2-20250905]$ ./tiup-cluster -v
tiup-cluster version 1.16.2 tiup
Go Version: go1.24.1
Git Ref: HEAD
GitHash: 2ba6ce0
v1.16.4(社区版)
tiup-cluster version 1.16.4 tiup
Go Version: go1.24.1
Git Ref: v1.16.4
GitHash: ea0611eb5afd6597a454901eeb5a539a1725718c
三、分析 v1.16.2 社区版 tiup-cluster:Prometheus 在 tiup cluster display 中被误判 Down 的原因
以下以社区版 tiup-cluster v1.16.2 的实现为依据,解释为何在开启 TLS 的场景下,tiup cluster display 可能将 Prometheus 误显示为 Down。
3.1 Prometheus 的 Up/Down 判定逻辑在哪里?
在 tiup v1.16.2 中,tiup-cluster display 对 Prometheus 的 Up/Down 判断最终落在 Prometheus 实例的 Status(timeout) 方法里。该方法会调用统一的探活函数 statusByHost()。
关键调用位于:
pkg/cluster/spec/monitoring.go(Prometheus 实例的状态判断) 调用代码如下:(源码链接:https://github.com/pingcap/tiup/blob/v1.16.2/pkg/cluster/spec/monitoring.go)
statusByHost(s.GetManageHost(), s.Port, "/-/ready", timeout, nil)
从这行代码可以直接看出:Prometheus 的状态是通过访问 /-/ready 探活接口得到的;并且最后一个参数传入的是 nil。
3.2 statusByHost() 的判定规则是什么?
探活函数位于:
pkg/cluster/spec/util.go(源码链接:https://github.com/pingcap/tiup/blob/v1.16.2/pkg/cluster/spec/util.go)
其核心逻辑如下(简化说明):
1)入参签名: func statusByHost(host string, port int, path string, timeout time.Duration, tlsCfg *tls.Config) string 其中 第 5 个参数 tlsCfg 表示 TLS 配置(包含 CA、客户端证书、私钥等)。
2)协议选择规则:
scheme := "http"
if tlsCfg != nil {
    scheme = "https"
}
也就是说:
tlsCfg == nil⇒ 访问http://tlsCfg != nil⇒ 访问https://
3) URL 拼接与探活接口:
url := fmt.Sprintf("%s://%s%s", scheme, host:port, path)  // path 这里传入 "/-/ready"
body, err := client.Get(ctx, url)
if err != nil || body == nil { return "Down" }
return "Up"
因此:
只要对
http(s)://<manage-host>:<port>/-/ready的 GET 请求失败/超时(err!=nil)或返回 body 为空,就会判定为 Down;否则判定为 Up。
3.3 为什么开启 TLS 后 display 显示 Prometheus 为 Down?
在 monitoring.go 的调用处(https://github.com/pingcap/tiup/blob/v1.16.2/pkg/cluster/spec/monitoring.go),statusByHost(..., nil) 固定传入 nil 作为 TLS 配置参数,如下图:

这会直接导致:
tlsCfg == nil⇒scheme被选择为 http- 最终探活请求变为:
http://<manage-host>:<port>/-/ready
如果当前环境(例如 TiDB 7.1.8-5.3)对 Prometheus Web 启用了 TLS / mTLS 或其他鉴权(需要 https 访问、需要证书或鉴权),那么 tiup 这种 http + 不携带证书 的探活请求会失败,触发:
err != nil⇒statusByHost()返回"Down"
3.4 结论
tiup-cluster v1.16.2 的 display 对 Prometheus 状态判断依赖 /-/ready 探活;但在当前实现中,Prometheus 的探活调用固定传入 tlsCfg=nil,导致探活只能使用 http 且不携带任何证书/鉴权信息。在 7.1.8-5.3 这种已经支持第三方组件鉴权的版本,当 Prometheus 开启 TLS 时,会导致 display 误判 Prometheus 为 Down。
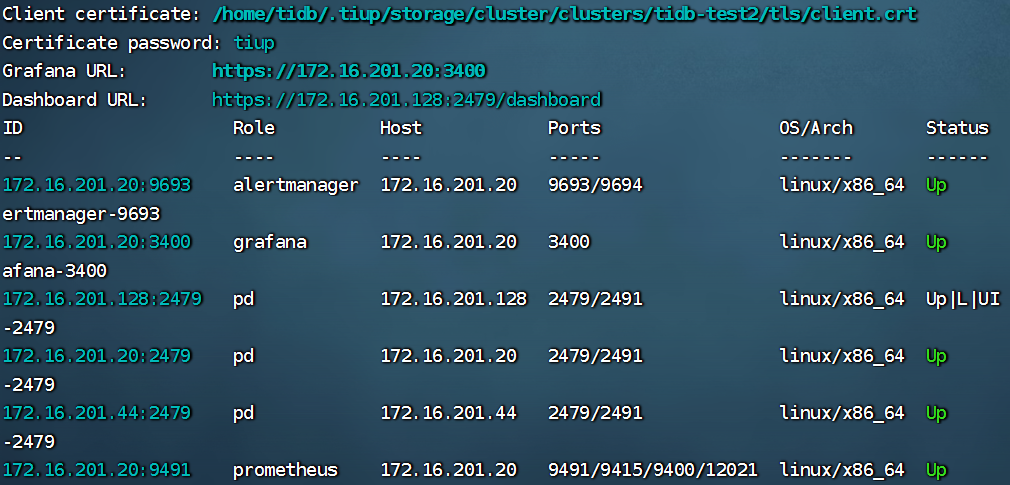
四、平凯数据库的 v1.16.2-20250905 怎么修复?
关键代码截图如下:
